

Methodology
Quaie’s methodology measures role-level change over time and converts those signals into decision-grade intelligence on enterprise AI adoption
The name Quaie reflects the field the company is built to study. Quaie stands for Quantitative Understanding of Artificial Intelligence in Enterprises. Artificial intelligence is the subject of analysis. Enterprise is the domain of impact. Quantitative structure provides direction and comparability over time, while qualitative judgement is used to interpret context, friction, and coordination that numbers alone cannot explain.
If you are new to Quaie, Sections 1, 3, and 12 are the essential reading. The remaining sections document the complete methodological architecture for those who want it.
1. The decisions Quaie is built to support
Quaie exists to support a set of executive decisions that determine whether artificial intelligence investment creates durable economic value or wasted spend.
The Role Layer research programme focuses on six decision contexts that repeatedly shape enterprise AI adoption.
Where is AI already creating repeatable economic value?
Which functions are successfully converting experimentation into stable operating leverage, and where value creation remains uncertain.
Which leadership roles lead adoption and which reliably follow?
Understanding the sequencing of adoption across leadership functions and where implementation initiatives are likely to succeed or stall.
Where will internal misalignment slow or block progress?
Identifying divergence between leadership roles that can delay investment, fragment strategy, or stall execution.
When does organisational consensus make action rational?
Estimating the time it typically takes for leadership systems to move from fragmented experimentation toward coordinated organisational commitment.
How aligned is the leadership system on AI strategy?
Assessing whether enterprise leaders share a common interpretation of the opportunity, risks, ownership, and priorities associated with artificial intelligence.
Which leadership roles most strongly influence adoption decisions?
Understanding which roles act as catalysts, validators, or gatekeepers in enterprise AI adoption.
These are leadership decisions that ultimately determine capital allocation. They shape when organisations invest, how they deploy resources, and whether artificial intelligence becomes a source of durable advantage or fragmented experimentation. They cannot be answered by vendors, dashboards, or static trend reports. Every element of Quaie’s methodology is designed to answer them directly.
2. The Role Layer Intelligence System
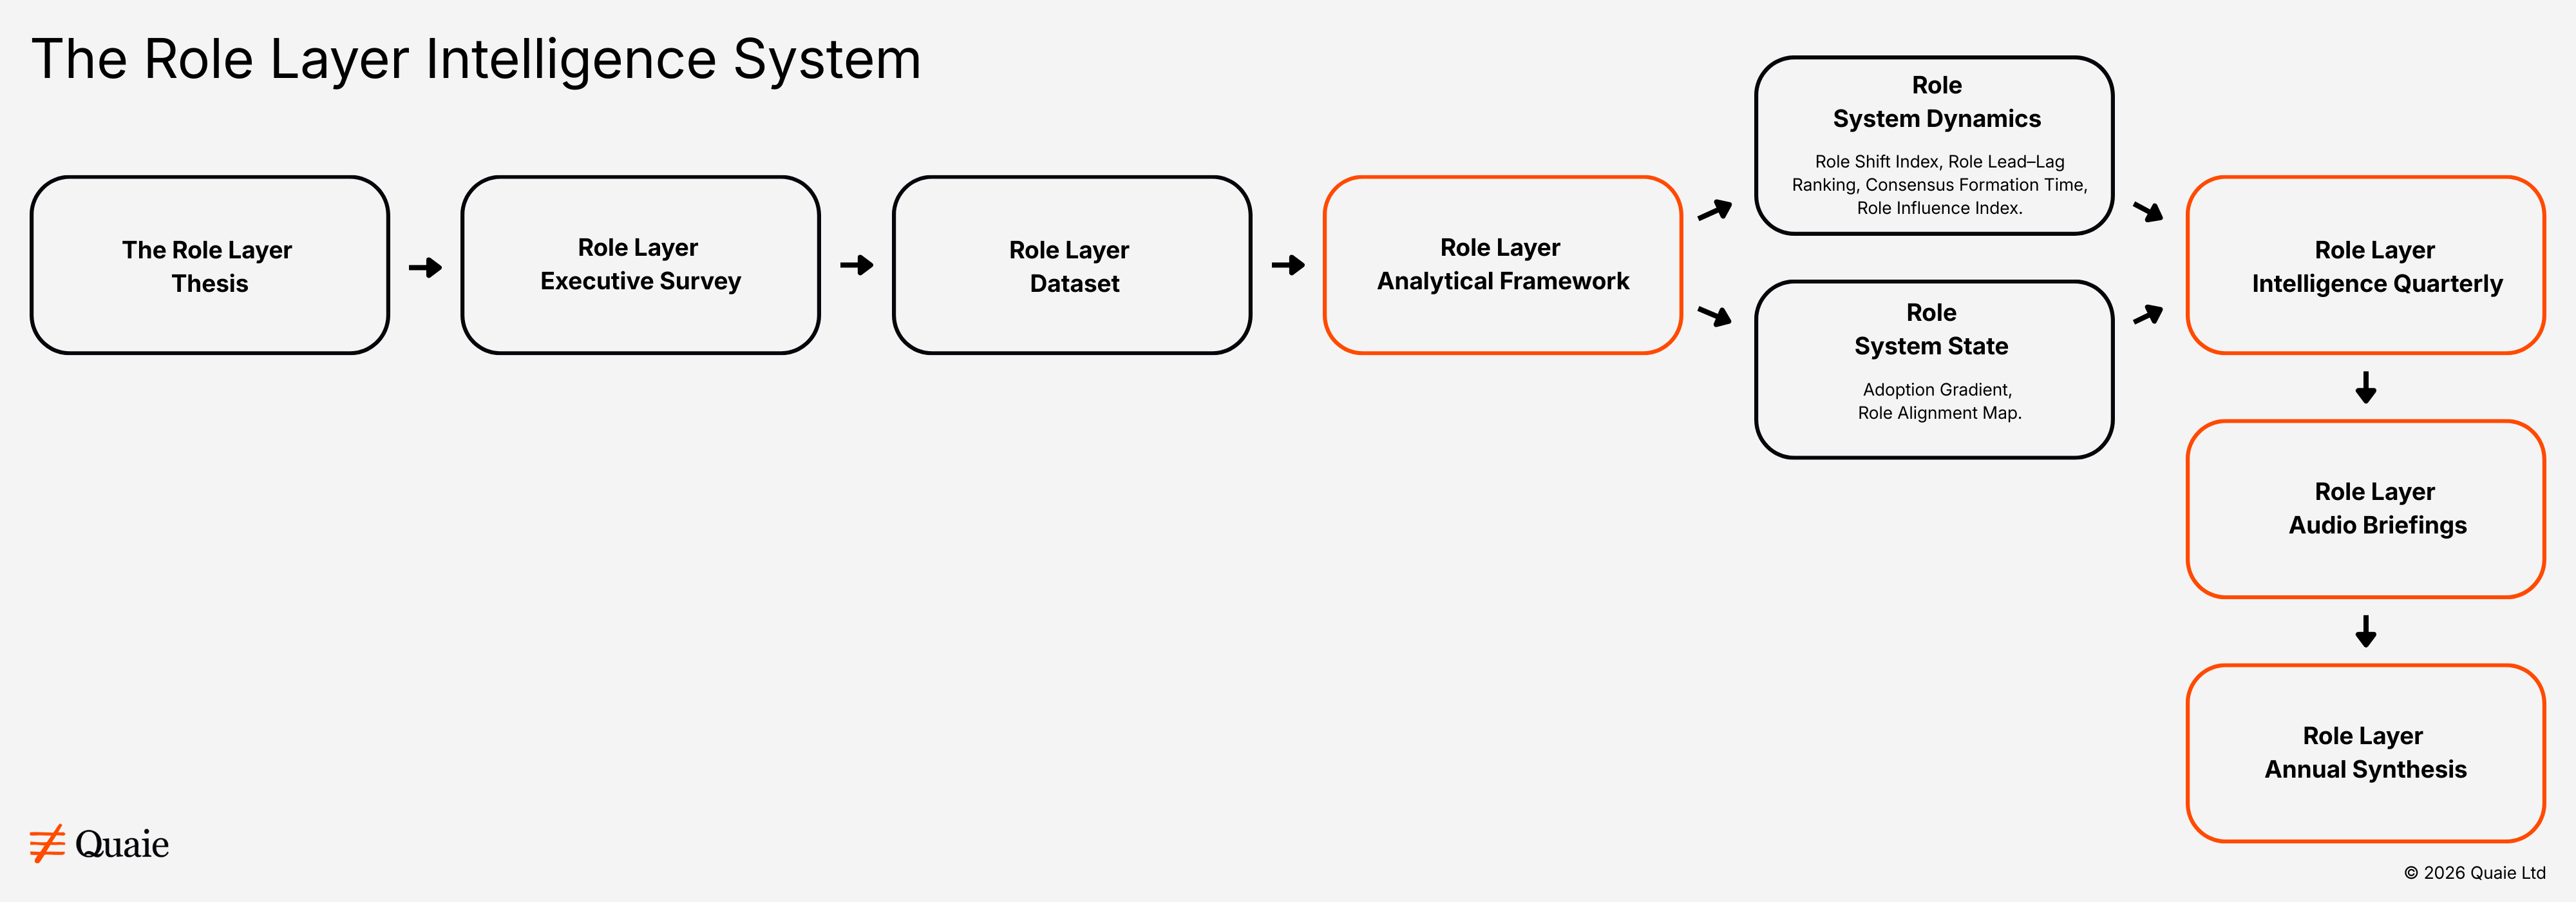
Quaie’s research operates through a structured architecture known as the Role Layer Intelligence System. The system converts role-level signals from enterprise leadership into longitudinal intelligence about artificial intelligence adoption. It consists of four core components: the Role Layer Thesis, a conceptual model explaining how enterprise AI adoption emerges through the interaction of leadership roles; the Role Layer Executive Survey, a stable quarterly research instrument capturing decision signals from senior enterprise leaders; the Role Layer Dataset, a longitudinal dataset capturing how leadership roles interpret and adopt artificial intelligence across enterprises over time; and the Role Layer Analytical Framework, a six-construct analytical system used to convert role-level signals into decision-grade intelligence.
Insights generated through this system are published through two primary outputs: The Role Layer Intelligence Quarterly and The Role Layer Annual Synthesis.
3. The Role Layer Thesis
Enterprise AI adoption does not occur uniformly across organisations.
Instead, adoption emerges through the interaction of leadership roles. Each role operates with distinct incentives, authority structures, and evidentiary thresholds.
Technology leaders evaluate technical feasibility and integration risk. Finance leaders evaluate capital allocation and return expectations. Marketing leaders consider customer impact and growth potential. Legal and compliance leaders assess regulatory exposure. Human resources leaders consider workforce implications.
These roles rarely move in lockstep.
Adoption therefore spreads unevenly through the leadership system before it becomes embedded across the organisation.
The Role Layer research programme measures how these role-level perspectives interact and how those interactions shape the pace, structure, and timing of enterprise AI adoption.
Why this matters
Enterprise AI adoption is fundamentally a leadership coordination problem, not a technology adoption problem. Technology capability alone does not determine organisational adoption. Leadership alignment, decision authority, evidentiary thresholds, and capital allocation determine whether AI initiatives stabilise into durable operating leverage or remain fragmented experimentation.
Technological adoption typically spreads through leadership roles before it spreads through organisations. Understanding how those roles interpret and coordinate around AI therefore provides an early view of how adoption will unfold.
Quaie’s research is therefore designed to observe the leadership system itself, measuring how roles move, align, diverge, and ultimately converge on organisational commitment.
4. Unit of analysis: Roles, not individuals
Quaie measures organisations through roles, not people.
The unit of analysis is a defined organisational role at a given point in time.
Quaie measures ten core executive functions — CEO, CTO/CIO, COO, CFO, CMO, CRO/CSO, CDO, CISO, CHRO, and CLO — each with distinct authority, incentives, and constraints that shape how AI adoption decisions form.
This reflects organisational reality. Authority, incentives, and constraints are role-bound. Decisions persist even as personnel change. Outcomes emerge from interaction between roles, not individual opinion.
Longitudinal comparability is achieved by repeatedly observing the same roles answering the same decision-level questions across successive research waves, not by tracking individuals.
5. The Role Layer Dataset
The Role Layer Dataset is a longitudinal role-level dataset capturing how enterprise leadership roles interpret and adopt artificial intelligence.
The observation unit is role perspective — not individual executives, specific organisations, or complete leadership teams within the same firm. Each quarterly research cycle samples leadership roles across enterprises. The dataset therefore measures how leadership roles interpret the same technological shift rather than attempting to reconstruct the internal dynamics of individual firms.
Role coverage
The dataset observes ten senior decision-maker roles within mid-to-large enterprises. These are the Chief Executive Officer, Managing Directors, and Founders; the Chief Technology Officer and Chief Information Officer, IT Directors, and senior technology leaders; the Chief Operating Officer, Operations Directors, and operations leaders; the Chief Financial Officer, Finance Directors, and senior finance leaders; the Chief Marketing Officer, Marketing Directors, and senior marketing leaders; the Chief Revenue Officer and Chief Sales Officer, Sales Directors, and commercial leaders; the Chief Data Officer, Data Directors, and senior data leaders; the Chief Information Security Officer, Security Directors, and senior security leaders; the Chief Human Resources Officer and Chief People Officer, HR Directors, and senior HR leaders; and the Chief Legal Officer, Legal Directors, and senior legal and compliance leaders.
6. The Role Layer Executive Survey and fieldwork
The Role Layer Dataset is generated through the Role Layer Executive Survey, conducted quarterly and hosted at survey.quaie.io. The survey is designed and analysed by the founding editor. It captures role-level signals from senior decision-makers across ten C-suite functions at mid-to-large enterprises and consists of 15 questions with an approximate completion time of 8 minutes.
The survey captures signals relating to AI adoption stage, duration at the current stage, confidence in economic value creation, decision blockers, evidence thresholds for commitment, leadership alignment, budget commitment, governance and regulatory considerations, functional deployment, investment timelines, and strategy ownership.
The survey instrument remains stable across quarters to ensure the dataset becomes longitudinal and comparable over time. Question wording, response options, and question order are locked. Any change to the instrument requires a documented methodology note in the relevant quarterly edition.
All responses are collected directly from senior decision-makers through direct outreach and organic survey participation. There are no panel providers, no incentivised completions, and no third-party aggregation of any kind. Every response is a direct contribution from a senior leader who completed the survey voluntarily. Survey responses are subject to a post-submission data quality review before inclusion in the published dataset. Responses are assessed for internal consistency across role, organisation size, sector, and adoption stage. Where email addresses are provided, domain consistency with the claimed organisational profile is verified. Responses that do not meet the data quality threshold are excluded from the published dataset and noted in the wave-level fieldwork record. The C-suite executives in this dataset chose to contribute. That distinction is the foundation of everything the Role Layer Intelligence System produces.
Data is collected in discrete research waves such as Q1 2026 and Q2 2026. Each wave functions as both a standalone snapshot and a comparable point in a growing time series. Coverage across leadership roles is monitored continuously to maintain role balance across research waves and to support longitudinal comparability rather than single-wave representativeness. Where roles are temporarily under-represented, recruitment is widened in subsequent waves, small-cell cuts are suppressed in reporting, and no extrapolation beyond observed responses is applied.
7. The Role Layer Analytical Framework
The Role Layer Dataset is analysed using the Role Layer Analytical Framework, which measures six dimensions of enterprise AI adoption. These constructs together form the analytical core of the Role Layer Intelligence System. The framework examines leadership systems through two complementary analytical lenses.
Role System Dynamics describes how adoption behaviour moves through leadership roles over time. It comprises four constructs: Role Shift Index, Role Lead–Lag Ranking, Consensus Formation Time, and Role Influence Index.
Role System State describes the condition of the leadership system at a given moment. It comprises two constructs: Organisational Adoption Gradient and Role Alignment Map.
Together these two analytical lenses allow Quaie to examine both how adoption behaviour evolves across leadership roles and the condition of alignment and maturity within enterprise leadership systems at any point in time.
8. The 23-Chart visual intelligence system
The Role Layer Analytical Framework produces 23 charts across four quarterly activation points.
15 charts are available from Q1. They cover the six construct outputs plus nine additional data and segmentation charts including revenue band adoption, sector adoption, blocker distribution by role, governance ownership, investment timing by role, confidence distribution, and role-level sample sizes.
4 charts activate from Q2 as the dataset accumulates a second wave. These longitudinal charts show movement for the first time — which roles are advancing, which are stable, and whether the Role Layer gap is closing or compounding.
2 charts activate from Q3. These include velocity data showing whether adoption movement is accelerating or decelerating and the first directional predictions of when role cohorts will approach coordinated commitment readiness.
2 charts activate from Q4. These include the confirmed Consensus Formation Time Prediction Model with robust confidence intervals and the Adoption Inflection Point Model identifying when each revenue band’s leadership system is predicted to cross from fragmented experimentation to coordinated scaled deployment.
Annual subscribers receive all 23 charts as the dataset builds across four quarterly waves.
9. Measurement layers: Quantitative and qualitative signals
AI adoption is not only a technical process. It is a decision-coordination process across leadership roles. To capture both the structure of adoption and the context surrounding leadership decisions, Quaie integrates two complementary measurement layers.
The quantitative layer captures structured survey responses relating to adoption stage, investment posture, leadership confidence, and decision constraints. These signals enable role-level time-series analysis and cross-role comparison.
The qualitative layer captures optional contextual explanations from participants. These insights surface factors such as governance risk, execution constraints, data readiness, budget authority, and organisational coordination challenges that structured responses alone cannot convey.
Together these two measurement layers allow Quaie to distinguish between experimentation, stabilisation, and durable organisational change.
10. Longitudinal intelligence without panels
Quaie’s longitudinal insight is structural rather than respondent-dependent. The research does not rely on tracking the same individuals over time. Instead, it repeatedly observes the same leadership roles answering the same decision questions across successive research waves.
Across time, Quaie observes how roles change their responses, how distributions shift, where alignment increases or fractures, and when uncertainty resolves into organisational commitment.
Longitudinality therefore emerges from role continuity rather than individual recall.
11. Proprietary analytical constructs
Quaie’s intelligence is built on six named, proprietary constructs. Each maps to a core executive decision context within enterprise AI adoption. Together these constructs measure how leadership roles change behaviour, influence one another, form consensus, and align around organisational commitment. They enable the Role Layer Dataset to move beyond descriptive reporting and into structured analysis of how leadership systems evaluate, coordinate, and commit to artificial intelligence investment.
11.1 Role Shift Index
Answers: where is AI already creating repeatable economic value?
A role-level measure of behavioural change over time, tracking movement from experimentation to stabilised deployment. Indicates which roles are converting pilots into operating leverage, where behaviour has stabilised into repeatable value, and where volatility signals unresolved experimentation. Used for budget prioritisation, investment validation, and separating structural value from noise.
11.2 Role Lead–Lag Ranking
Answers: which roles lead adoption and which reliably follow?
A temporal mapping of adoption and conviction across roles. Indicates predictable sequencing patterns, median delays between role cohorts, and catalyst, validator, and blocker roles. Used for rollout sequencing, change programme design, and reducing wasted effort.
11.3 Organisational Adoption Gradient
Answers: where will internal misalignment slow or block progress?
A measure of divergence between roles at the same point in time. Indicates readiness gaps between leadership roles, friction points that predict stalled adoption, and misalignments that resolve versus those that persist. Used for board-level risk assessment, intervention planning, and explaining stalled execution.
11.4 Consensus Formation Time
Answers: when does organisational consensus make action rational?
A model of how long it typically takes for roles to move from fragmented experimentation to coordinated, budgeted action. Indicates historical consensus ranges, early indicators that action is becoming rational, and signals that commitment remains premature. Used for investment timing, board justification, and avoiding early or late entry.
Commitment readiness threshold
The commitment readiness threshold of 3.5 on the Consensus Formation Time composite scale is the reference point above which role cohorts are considered approaching coordinated investment commitment readiness. This threshold will be validated empirically from Q2 onward by comparing the subsequent investment behaviour of role cohorts that scored above 3.5 in Q1 against those that scored below it. If the empirical data at Q3 suggests a different threshold is more predictive, the threshold will be adjusted and the adjustment documented transparently in the Q3 methodology note.
11.5 Role Alignment Map
Answers: how aligned are leadership roles on AI strategy?
A measure of the degree to which leadership roles converge on priorities, ownership, and strategic direction for artificial intelligence initiatives. Indicates agreement or divergence in strategic interpretation of AI opportunity, alignment on ownership of enterprise AI programmes, and whether leadership systems are converging toward coordinated strategy. Used for assessing organisational readiness for scaled deployment, identifying leadership fragmentation before execution stalls, and understanding where coordination effort is required.
11.6 Role Influence Index
Answers: which leadership roles most strongly influence adoption decisions?
A measure of the relative influence of leadership roles on enterprise AI investment and deployment decisions. Indicates which roles act as primary catalysts for adoption, which roles function as validators or gatekeepers, and how influence patterns shift as AI moves from experimentation to operational deployment. Used for understanding decision authority within leadership systems, identifying leverage points for organisational change, and interpreting how adoption trajectories evolve over time.
12. Scoring methodology
Each of the six constructs is derived from the Role Layer Executive Survey using combinations of survey variables selected for their analytical relevance to the question each construct is designed to answer.
The Role Shift Index and Role Alignment Map are calculated as the mean score for each role cohort on their respective primary measurement variables. The Role Lead–Lag Ranking, Consensus Formation Time, and Role Influence Index are calculated as weighted composite scores derived from two to four survey variables each. The Organisational Adoption Gradient is calculated as the spread between the highest and lowest role cohort scores on the Role Shift Index.
The specific input variables and weighting methodology for all constructs are proprietary to Quaie. The composite construct weightings are locked for longitudinal comparability and are subject to a formal review process documented in Quaie’s internal methodology specification. The construct names, the questions they are designed to answer, and the scales used in their measurement are documented on this page.
All construct scores are reported on a 1 to 5 scale. All scores are calculated as continuous values reflecting the distribution of role cohort responses rather than single categorical assignments.
13. Measurement scales
The following scales are used throughout the survey and the report.
AI adoption stage — five points 1 = No active initiatives or early exploration 2 = Experimenting with pilot projects 3 = Limited production use in specific areas 4 = Scaled deployment across multiple functions 5 = AI embedded in core operations
Leadership alignment — five points 1 = Significant disagreement 2 = Limited alignment 3 = Partial alignment, some roles converging others not 4 = Broad alignment with minor gaps 5 = Full alignment across senior leadership
Confidence in economic value — five points 1 = No confidence 2 = Low confidence 3 = Too early to tell 4 = Moderate confidence 5 = High confidence
The Too early to tell response is treated as a midpoint value in construct scoring, reflecting its position as the central response option.
Budget commitment — five points 1 = No dedicated AI budget 2 = Pilot or exploratory budget only 3 = Departmental budget allocated to specific functions 4 = Enterprise-wide budget allocated across multiple functions 5 = Board-level strategic investment with multi-year commitment
Investment timeline — five points scored so that sooner commitment equals higher score Already committed = 5 Within 6 months = 4 6 to 12 months = 3 12 to 24 months = 2 No current plans = 1
14. Perceptual measures and role-level aggregation
Two questions in the Role Layer Executive Survey ask respondents to rate their perceptions of their leadership system rather than objective facts about their organisation. The leadership alignment question and the confidence in economic value question are inherently subjective measures. Different respondents describing the same leadership team will produce different scores.
This is not a methodological flaw. It is the analytical feature that makes the Role Alignment Map and Consensus Formation Time constructs their most valuable outputs. The Role Alignment Map does not claim to measure the objective alignment state of a leadership team. It measures how each C-suite function perceives the alignment state of the leadership system from the vantage point of their role.
The aggregation to role cohort means across multiple organisations reduces individual response variance while preserving the role-level signal. The mean alignment rating of 14 CEOs across 14 different organisations is a role-level pattern — a consistent tendency for the CEO function to perceive alignment differently from the CHRO function across many different leadership systems. That pattern is analytically significant regardless of any individual organisation’s actual alignment state.
15. Reporting structure and exhibit discipline
Quaie publishes The Role Layer Intelligence Quarterly, a predictive-intelligence report structured around the six constructs of the Role Layer Analytical Framework. Each construct is supported by a repeatable exhibit grammar including role-level trend charts, distribution shifts, heatmaps and gradients, time-series comparisons, and qualitative insight callouts. This consistency allows readers to learn how to read Quaie once, track change quarter-over-quarter, and compare across roles and segments.
16. Data reporting standards
Any cross-tabulation cell with fewer than 10 respondents is suppressed in the reported analysis and noted as below reporting threshold. Any cross-tabulation cell with 10 to 19 respondents is reported with an explicit directional caveat. Any cell with 20 or more respondents is reported as a substantive finding. Sectors with fewer than 5 respondents are excluded from all reported sector analysis.
17. Predictive intent and longitudinal validation
Quaie’s research is designed not only to describe current conditions but to support forward inference about how enterprise AI adoption will unfold. The dataset captures a combination of current adoption state, role-level conviction, expected investment timing, decision constraints, and alignment across leadership functions. These signals are treated as hypotheses about future organisational behaviour. Their value emerges through longitudinal validation as signals captured in one research wave are evaluated against developments observed in later periods.
18. Interpretation standards
Findings are framed as signals, patterns, and trajectories rather than deterministic forecasts. Language remains disciplined and consistent.
Early signals suggest. Directional patterns indicate. Role-level responses show.
Small cells are suppressed. Outliers are contextualised. No extrapolation beyond the data is applied.
19. Why this methodology works
Quaie combines role-based measurement, longitudinal observation, and proprietary analytical constructs to capture how enterprise leadership systems interpret and adopt artificial intelligence.
By observing how leadership roles move, align, diverge, and ultimately converge on organisational commitment, Quaie is able to detect signals of adoption before outcomes are visible in operational or financial results.
The resulting dataset does not merely describe the market. It enables longitudinal insight today and predictive foresight as those signals are validated and compound over time.
This is the methodological foundation of Quaie.
20. Research ethics
Given the organisational sensitivity of AI adoption decisions and the longitudinal nature of the dataset, Quaie sets out its research ethics principles separately. A brief statement outlining how contributions are handled, anonymised, and interpreted is available here: Research Ethics
21. Editorial and commercial independence
Quaie’s research is produced under an explicit framework of editorial and commercial independence. The company does not accept sponsorships, paid placements, lead-generation arrangements, or other commercial relationships that would influence the framing, interpretation, or publication of its analysis.
This policy exists to ensure that Quaie’s incentives remain aligned with contributors and readers, and that findings are not shaped by the commercial interests of vendors, agencies, investors, or other market participants who may also engage with the research.
The full statement is available here: Editorial and Commercial Independence